[A version of this piece appeared on The Fifth Estate website last week.
For more information on this topic, see: theoneplanetlife.com]
For more information on this topic, see: theoneplanetlife.com]
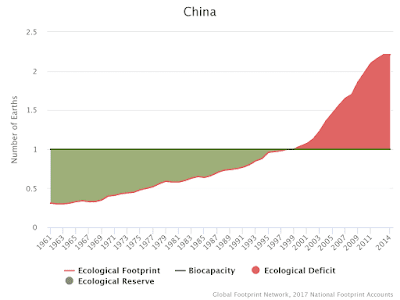
Mathis Wackernagel, founder and CEO of Global Footprint Network, speaking in an interview with me from Oxford University just before the launch, said, "We may have reached peak eco-footprint, after years of expansion. For example, China underwent a rapid expansion of its footprint, and now it has flattened. This could be a real trend."
 |
| Peak consumption? In 1961 China was consuming the equivalent of 0.31 Earths of biocapacity, but since then rocketed to 2.21 Earths, where it has sat for the last two years of data. |
What is ecological footprint?
Ecological footprint is a shorthand way of understanding the relationship between our consumption of resources and the capacity of the planet to provide them and absorb the pollution we cause.Every individual, a community or nation has their own ecological footprint. It is the biologically productive space needed to renew all that we demand from nature. For the world as a whole, it was in the early 1970s when humanity started consuming more than the planet could regenerate. From then on we have been in deficit, implying that we cannot carry on consuming at this level without ever-stronger risk of ecological crises.
Global Footprint Network has been providing this country and planetary level data for many years but last week’s launch also saw the launch of a new data platform and an open source system, meaning that anyone can now freely explore and interrogate the data on global or national bases.
The new data is compiled from statistics provided by the United Nations and, being complicated to collect, is always three or four years behind the current year. The first year in which the data was collected was 1961. The new website currently provides time series of data for every year between 1961 and 2014.
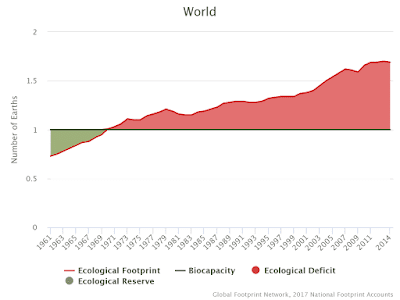
This is what the world’s ecological footprint looks like over this period:
 |
| From 1961 to 2014 we have gone from exploiting 0.63 Earth-equivalents to 1.69, approximately flatlining for four years. |
“We don’t know whether or not this is a blip or a trend. It is too early to say,” Wackernagel said.
 |
| Mathis Wackernagel |
Individual country data compares consumption data to biocapacity data. What Wackernagel is referring to here is that India, despite having a total per capita footprint of 0.67 Earth-equivalents, is in deficit in relation to what it is able to supply itself to feed its consumption, and is therefore using biocapacity from other countries to fuel its rapid pace of development.
The data is compiled from UN information on population and the amount of built-up land, carbon emissions, cropland, fishing grounds, forest products and grazing land.
For the world as a whole, the peak was in 2011. It is interesting to compare the statistics for 1961, 2011 and 2014 to see what has changed to cause this overall peaking:
| Year | Built-up land | Carbon emissions | Cropland | Fishing grounds | Forest products | Grazing land | Total |
| 1961 | 0.026 | 1.005 | 0.465 | 0.096 | 0.431 | 0.265 | 2.288 |
| 2011 | 0.061 | 1.779 | 0.533 | 0.087 | 0.281 | 0.147 | 2.888 |
| 2014 | 0.064 | 1.707 | 0.550 | 0.093 | 0.278 | 0.144 | 2.835 |
The amount of built-up land has steadily increased over the entire period, but carbon emissions have recently slightly decreased. While the amount of fishing grounds, forest products and grazing land have all continued to decline, the amount of cultivated land is almost back to the level of 1961.
Biocapacity is also shrinking quite rapidly per person, so even though per person ecological footprint has not changed that much, its ratio to biocapacity has become ever more unfavourable.
This implies pressures on biodiversity. It does not tell us about the nitrogen and phosphorus pollution caused by this increase in agriculture. For this we have to look for other statistics not covered by the ecological footprint metric, but covered by a different metric – planetary boundaries, collated annually by the Stockholm Resilience Centre.
As can be seen in the above diagram this is one of the four boundaries that have been exceeded.
Australia and the UK
The website allows anyone to play with the data. Let’s compare, for example, the ecological footprints of Australia and the UK.Australia is using the resources of 4.09 Earths, down from a peak of 5.15 Earths in 2011.
The UK is using the resources of 2.85 Earths, down from a peak of 3.55 Earths in 2011.
In addition, both of these countries’ ecological footprints of consumption (in global hectares divided by population) have declined slightly since their peaks, in 2008 and 2007 respectively:
 |
Australia's ecological footprint in terms of the number of Earths needed to sustain it, if everyone on the planet had the same level and impact of consumption as Australia does. |
 |
| The UK's ecological footprint, pictured the same way. The UK's has reduced since the financial crisis of 2007. |
In the UK’s case, if we drill down to the category level, the reason for the fall is solely a reduction in carbon emissions (which is largely due to a switch for gas to coal-powered electricity generation, but also due to a cut in fishing grounds due to previous over-fishing). The area of built-up land has just over doubled since 1961:
UK time series:
| Year | Built-up land | Carbon emissions | Cropland | Fishing grounds | Forest products | Grazing land | Total |
| 1961 | 0.068 | 3.835 | 0.803 | 0.396 | 0.297 | 0.751 | 6.150 |
| 2007 | 0.139 | 4.240 | 0.815 | 0.103 | 0.623 | 0.324 | 6.245 |
| 2014 | 0.156 | 2.996 | 0.832 | 0.082 | 0.483 | 0.250 | 4.799 |
 |
| UK's ecological footprints in 1961, 2007 and 2014. |
In Australia’s case, again there was a decline in carbon emissions. The area of built-up land has almost tripled since 1961:
Australia time series:
| Year | Built-up land | Carbon emissions | Cropland | Fishing grounds | Forest products | Grazing land | Total |
| 1961 | 0.024 | 3.026 | 0.527 | 0.049 | 1.031 | 2.813 | 7.471 |
| 2008 | 0.047 | 5.867 | 0.872 | 0.127 | 1.206 | 0.872 | 8.992 |
| 2014 | 0.063 | 4.700 | 0.679 | 0.122 | 0.863 | 0.458 | 6.886 |
 |
| Australia's ecological footprints in 1961, 2007 and 2014. |
Other trends are not improving, however.
What can be done?
Despite the levelling out, Wackernagel remains alarmed by humanity’s unsustainable activities.“People don’t look at this stuff. Instead, they’re buoyant about labour productivity, but this came about because of cheap energy and resources. Now we need to maintain our quality of life but reduce resource use.”
But he sees a way out.
“Total and ever-lasting decoupling of economic growth from resource consumption is not possible. Some may be possible. But it takes resources to run an economy. Our data shows how the resource dependence of most countries have increased, even though we have more efficient technology. For instance, we can calculate the average resource intensity in the world – or nations or cities – by sectors. This points out which sectors are within resource intensities that are consistent with the one-planet budget, and which ones are on a collision course.”
Cities are beginning to employ ecological footprinting methods to track the demand on nature of different types of development. To do this other sources of data are added to those on the website.
“We are starting work with six cities in Portugal. We are also in conversation with the Wuppertal Institute, Germany, to run a campaign on all the larger German cities and drive up demand for sustainable solutions,” Wackernagel said.
“They recognise there is a danger of stranded assets due to having exceeded planetary boundaries.
“The framing of the argument is important. The ecological footprint calculator may come over as negative, generating a sense of sacrifice and suffering. We should ask: what is the best move to secure lasting development improvements for us? The alternative – encouraging expansionism – is dangerous.”
Cities can use their own detailed information, he says, to compile a “consumption land use matrix for a city”.
“This details how various consumption activities contribute to the overall demand. Then, using local consumption statistics, this can be extended into the past and future to evaluate trends in the city’s resource performance.”
This has been done already in Calgary, Canada, where consultants worked with a planning department to reduce the level of impact of a new housing development.
The ecological footprint is a useful tool alongside other tools. Although time will tell whether the impact of human consumption on the planet has peaked, it is still at an unsustainable level. It will take much work to actually reverse the rise of the last decades to a sustainable one, especially given the inexorable rise of human population and urbanisation.
For more information on this topic, see: theoneplanetlife.com
David Thorpe is the author of The One Planet Life, about living within planetary boundaries, Passive Solar Architecture Pocket Referenceand Sustainable Home Refurbishment.


No comments:
Post a Comment